移動速度に応じたオプティカルフローの可視化
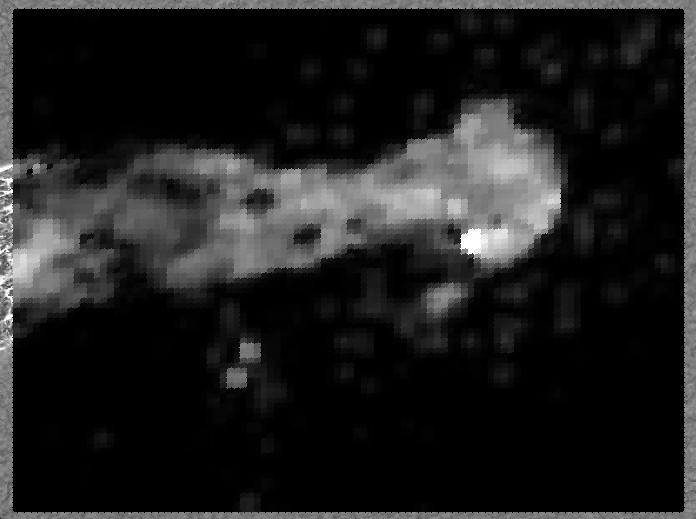
細胞の移動速度に応じてグラデーションでその速度を表示したヒートマップを作成します。このページのコードでは、移動量を表すベクトルはfxyというPoint型の構造体に収められています。fxyは、fxy.x または fxy.y とすることでx、yの値を取り出すことができます。したがって、ベクトルの大きさは、pow(pow(fxy.x,2)+pow(fxy.y,2),0.5) というように計算することができます。前回のコードから実際に書き換える部分は3行のみです。
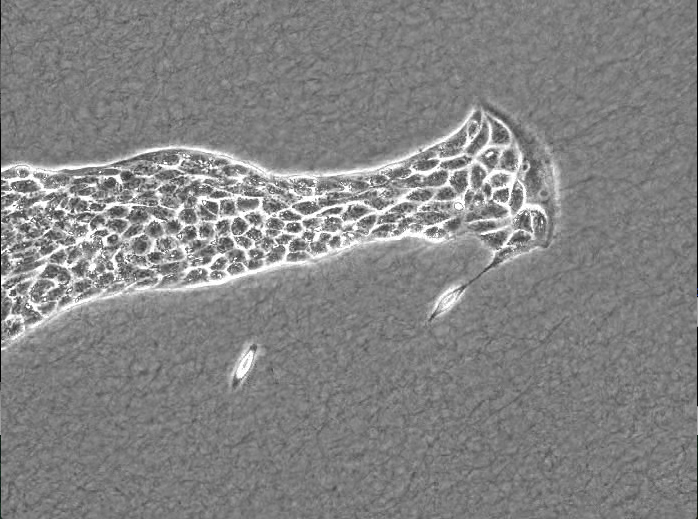
細胞遊走の動画を入力に用いると次のように各局所区画の移動速度に応じて、遅いほど黒く、速いほど白く表示されます。
#include "stdlib.h"
#include "opencv/cv.h"
#include "opencv/highgui.h"
#include "string.h"
#include "stdio.h"
#include "iostream"
#include "math.h"

using namespace std;
using namespace cv;

int main(){

    VideoCapture cap("/Users/YM/Desktop/srep07656-s2.avi");

    int Width=cap.get(CV_CAP_PROP_FRAME_WIDTH);
    int Height=cap.get(CV_CAP_PROP_FRAME_HEIGHT);
    int max_frame=cap.get(CV_CAP_PROP_FRAME_COUNT); //フレーム数


    Mat source(Height,Width,CV_8UC1);
    Mat HIS_source(Height,Width,CV_8UC1);

    for(int frame=0; frame<max_frame; frame++){
        cap>>source;
        Mat disp=source.clone();
        cvtColor(source, source, CV_BGR2GRAY);

        if(frame>0){

            vector<cv::Point2f> prev_pts;
            vector<cv::Point2f> next_pts;

            Size flowSize(100,100);
            Point2f center = cv::Point(source.cols/2., source.rows/2.);
            for(int i=0; i<flowSize.width; ++i) {
                for(int j=0; j<flowSize.width; ++j) {
                    Point2f p(i*float(source.cols)/(flowSize.width-1),
                                  j*float(source.rows)/(flowSize.height-1));
                    prev_pts.push_back((p-center)*0.95f+center);
                }
            }

            Mat flow;
            vector<float> error;

            calcOpticalFlowFarneback(HIS_source, source, flow, 0.8, 10, 15, 3, 5, 1.1, 0);

            // オプティカルフローの表示
            std::vector<cv::Point2f>::const_iterator p = prev_pts.begin();
            for(; p!=prev_pts.end(); ++p) {
                const cv::Point2f& fxy = flow.at<cv::Point2f>(p->y, p->x);
                //cv::line(disp, *p, *p+fxy*8, cv::Scalar(0),1); //この行を削除
                double length=pow(pow(fxy.x,2)+pow(fxy.y,2),0.5); //この行を追加
                circle(disp, *p, 5, length*50, -1, 4); //この行を追加
            }

            HIS_source=source.clone();

            imshow("vector", disp);
            imshow("source", HIS_source);

            int c = waitKey(1);
            if(c==27)return 0;
        }

        cout<<frame<<endl;
        frame+=1;
    }
    waitKey(0);
    return 0;
}


